The Impossible Three-Color Map
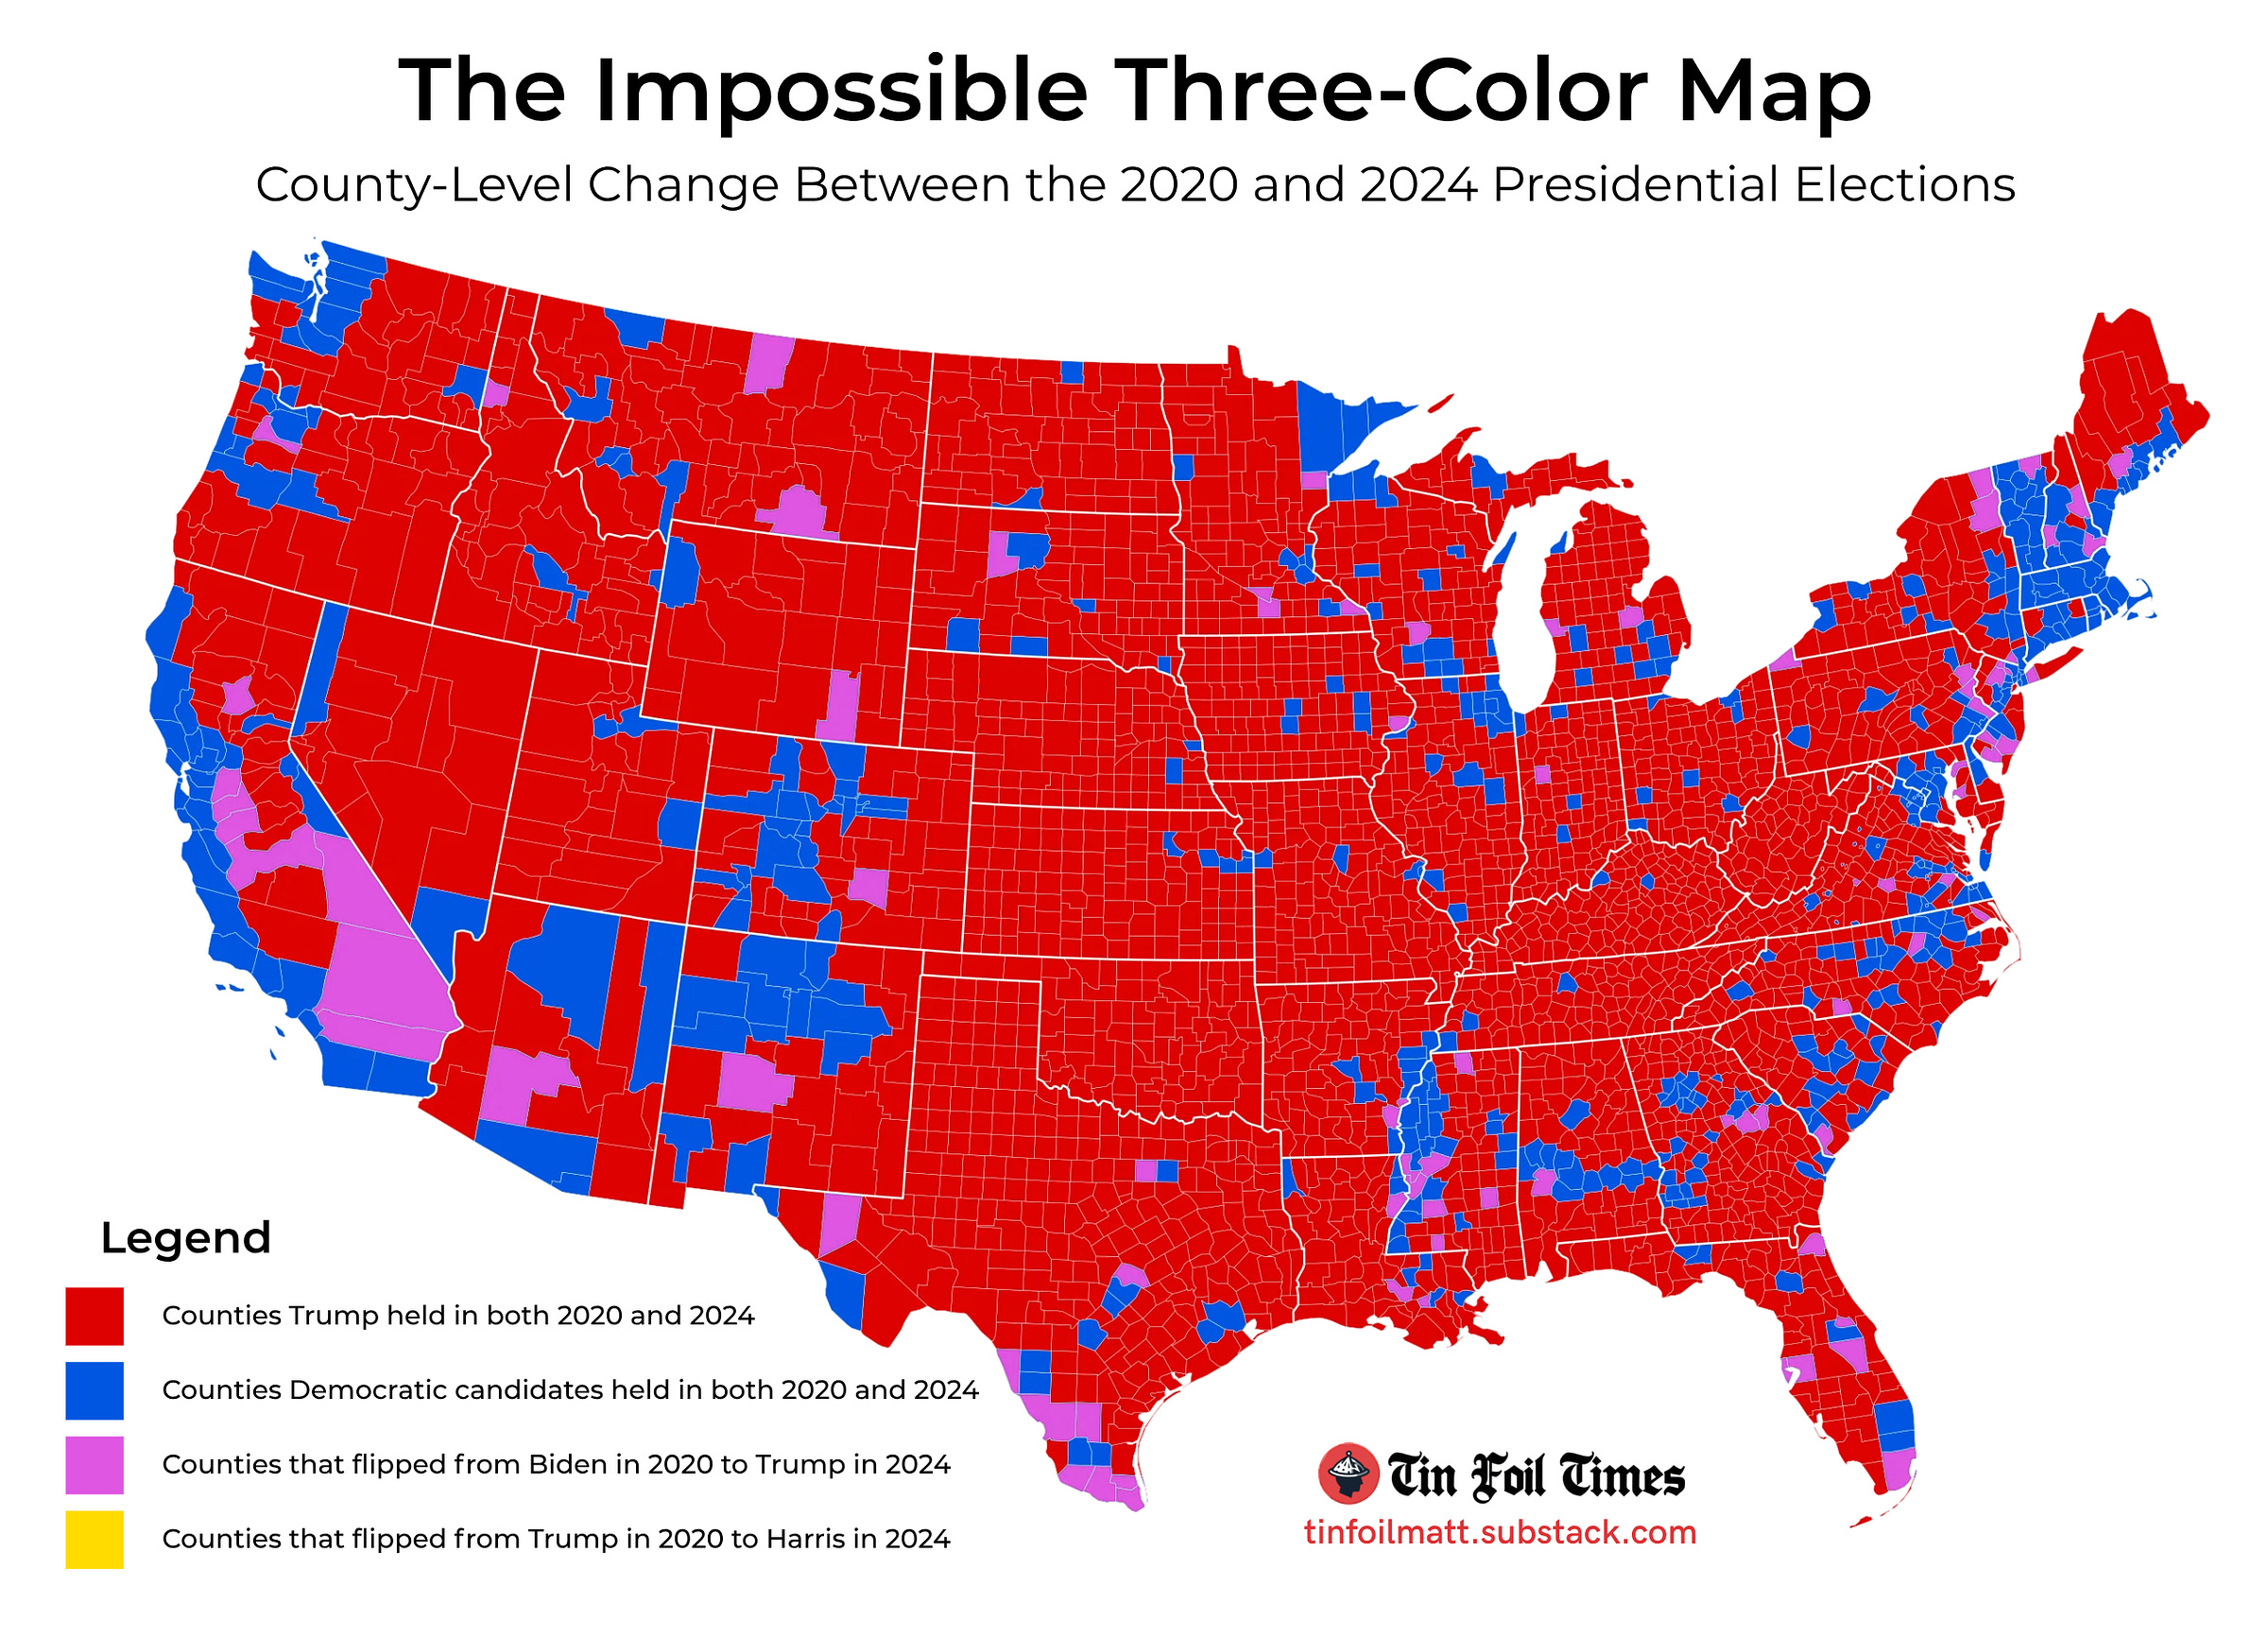
Update #12 | 83 counties flipped for Trump, 0 for Harris. That seems impossible.
If you haven’t read the original post,
I highly recommend reading it first ↓
Update #12
Is it just an odd trivia tidbit?
I came across an interesting fact about the 2024 election—while former President Donald Trump won 83 counties that had voted for President Joe Biden in the prior election, Vice President Kamala Harris only flipped… zero.
Not a single one.
Trump was able to hold onto every county that he won in 2020, all 2,497 of the more than 3,100 counties across the country. And then he went on to win an additional 83 counties while barely clinging to 50% of the vote.
Here’s what that looks like on the map:
Lots of red, some blue. A little purple.
But where’s the yellow? To not have that fourth color is a striking anomaly.
Different regions of the U.S. and diverse social or ethnic groups align with presidential candidates in distinct ways. A candidate's articulation of values and positions on key issues—especially in contrast to rivals or previous party nominees—can significantly influence voting patterns across counties, regions, or entire states.
Even within the same party, no two candidates are identical. As a result, it is expected that some counties may shift or change party allegiance when a new candidate emerges.
Usually, that looks like this:
In the 2016 election (results pictured), some counties flipped Democratic, while some other counties flipped Republican. The majority of voters in those counties didn’t exhibit consistent party loyalty; instead, their voting behavior was influenced by the usual variety of factors: candidates’ individual platforms, current events, economic conditions, or shifts in social and cultural dynamics. These external influences regularly cause some counties to swing or change party allegiance with each new candidate.
Please take ten seconds to share this article and help get the word out!
Donald Trump didn’t just steal the election, he stole America’s future. And it will stay that way unless we do something about it.
Even in the rare case of a rematch between the same two candidates, changing factors—like economic conditions or the incumbent’s perceived competency—can shift voter behavior differently in each county. What benefits one county may not in another, as voter preferences are shaped by complex local and national dynamics. This should make it inevitable that some counties will swing from Trump in 2020 to Harris in 2024, reflecting the evolving nature of voter decisions.
That’s doubly true with how divisive Trump is on so many issues, from democracy itself to reproductive rights, and with the unprecedented level of support Harris received from Trump’s former staffers and other prominent Republican figures.
It also seems highly implausible that Americans across the nation would vote with such remarkable consistency between the 2020 Trump vs. Joe Biden race and the 2024 Trump vs. Harris election, given that Biden and Harris differ significantly in age, gender, ethnicity, background, and birthplace. It seems safe to assume such stark contrasts between the Democratic candidates would influence voter behavior and lead to shifts in electoral outcomes.
But they didn’t. There wasn’t a single place in the country, from sea to shining sea, where Harris’ strengths or Trump’s weaknesses caused a county’s electorate to flip-flop from red to blue.
Zero. Zilch. Zip. Nada. Over 3,100 counties, and not even one speck of yellow on the map.
Or is it an obvious sign of interference?
As far as I can tell (because county-by-county data isn’t consistently available online, at least for free), it’s never happened before that a candidate failed to flip at least one county.
Democratic candidate Walter Mondale suffered one of the most lopsided losses in his failed 1984 presidential bid, paving the way for Ronald Reagan’s reelection. Reagan won 49 states, earned 525 electoral college votes to Mondale’s 13, and took 18.2% more of the national popular vote. It was an utter blowout.
But even Mondale flipped 31 of the counties Reagan had previously won in 1980.
In contrast, 2024’s was a historically close election. According to ABC, “Since the end of World War II, only three elections had popular-vote margins smaller than Trump's current 1.6-point lead: 1960, 1968 and 2000.” Despite Trump’s claims of having won “a mandate” in what he says was a landslide election, it appears that pollsters’ forewarnings about 2024 shaping up to be “the closest presidential election since 1876” were well-founded.
So where’s the yellow?
I don’t think these results are statistically possible. Prove me wrong.
If you’re a math wiz and have feedback about this next section, I welcome your input. Email corrections to tinfoilmatt@proton.me.
I’m good at many things, but statistics isn’t among them.
However, my gut tells me that Trump flipping 83 counties and Harris flipping zero is simply not possible. I understand that an election isn’t random; clearly many factors impact how the electorate behaves, and it wouldn’t be feasible to account for all of them.
But I can estimate a basic statistical analysis. To account for all those unaddressed factors, we can use an extreme example that weighs the estimate significantly in Trump’s favor. For the sake of this “beyond the worst-case” analysis, let’s assume the following:
There’s only a 1% chance that Harris flips a red county blue
There’s a 50% chance that Trump flips a blue county red
As I said, extreme. A cursory glance at historical data suggests the real chance of a county flipping is about 10% per election. So with these beyond-conservative assumptions, we can go ahead with our calculation:
It’s highly likely that Trump would be able to flip 83 or more of Biden’s 477 total blue counties, with a 50% chance per county.
However, it’s extremely unlikely that Harris would fail to flip even a single of Trump’s 2,497 counties, even with just a 1% chance per county.
Ultimately, the odds of this shake out to being about 1 in 79 billion.
Even under extremely favorable assumptions for Trump, the odds of this scenario occurring are astronomically low. In reality, the probabilities of flipping counties are far smaller than the assumed p=0.5 for Trump and far larger than p=0.01 for Harris. Adjusting to realistic values would make the scenario even more improbable.
Unless I’ve made a grave mistake in my methodology, it’s conclusive for our purposes: It’s statistically impossible that Harris didn’t flip even one county.
Consider the following unlikely scenarios from fivethirtyeight.com:
Some of these are relatively likely (such as the 71 out of 100 chance of Harris winning the national popular vote), some are rare (such as the 1 out of 100 chance that every state votes for the same party that it did in 2020), but none are even remotely close to 1 out of 79 billion.
As an analogy:
Imagine hiding a golden fortune inside a single fortune cookie, at random, and then distributing ten fortune cookies to each of the 8 billion people on Earth. For Trump to achieve this outcome, he would need to pick the one cookie containing the golden fortune on his very first try.
Okay, so what does it mean?
Honestly, I’m not exactly sure. But it seems like it means a few things:
The election results were tampered with.
The manipulation of election results happened all over the country, even outside the swing states.
The weird data we’re seeing is a sign that whatever method was used to manipulate vote totals/tabulation was too consistent and created a relationship between Harris’ vote totals and Trump’s vote totals, where a relationship should not exist.
There should never be a three-color map.
More soon.
A note on The Impossible Three-Color Map: Alaska doesn’t use counties for voting, but instead uses election districts that change each election, so it’s excluded from the map. Hawaii decided not to join in solidarity with its non-contiguous brother. Both states followed the trend visible in the rest of the country.
Edit: A prior version of this article used an outdated number of Trump flipping 54 counties, whereas he actually flipped 83. This has been corrected as of 3 p.m. Eastern on Wednesday, Nov. 27, 2024.
If we don’t take action to defend democracy, we don’t deserve to keep it.
If you have relevant information to contribute, please email: tinfoilmatt@proton.me


